On Tuesday, I joined Ann Berry on Public.com to discuss the Fed, Strong Jobs Report, Inflation and Hikes moving forward. Thanks to Ann and Mike Teich for having me on (turn up the volume a bit to hear Ann):
Here is a clip from the CEO of Yum! Brands (NYSE:) yesterday confirming what I said to Ann (less pressure on wages, easier to fill positions):
Since the strong jobs report on Friday, people have been concerned about how much more the Fed will have to hike to offset the strength in the economy.
Source: All blue charts are from MUFG – Joyce, Orr, Kendal
On the one hand, it’s good (job creation) and shows the economy is strong and can withstand all of the tightening that has taken place during the past year.
On the other hand, bears point to the fact that people are spending all of their excess savings:
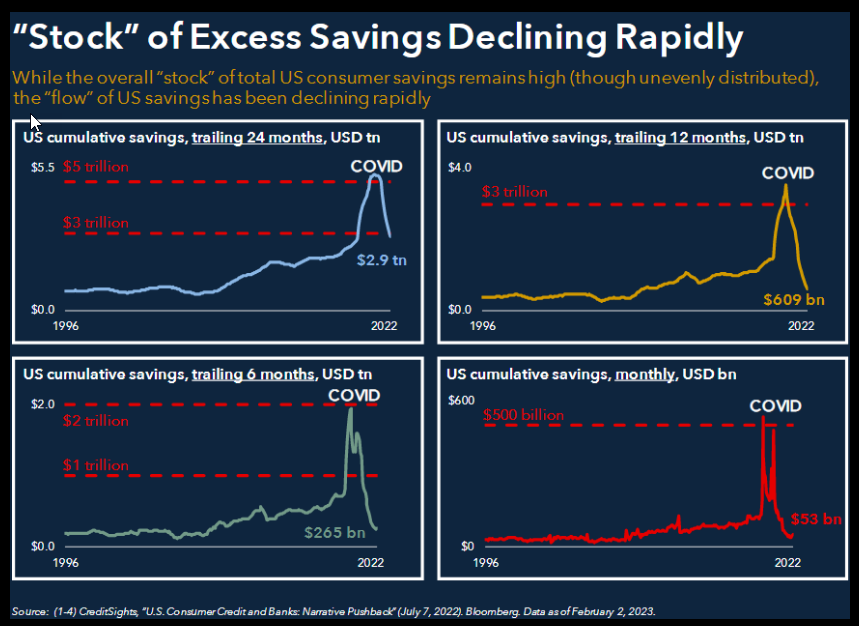
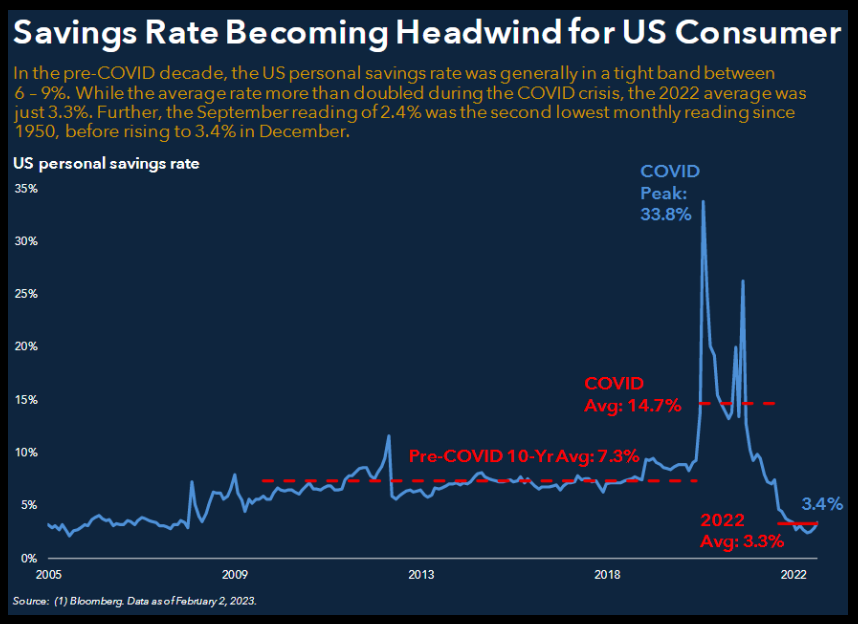
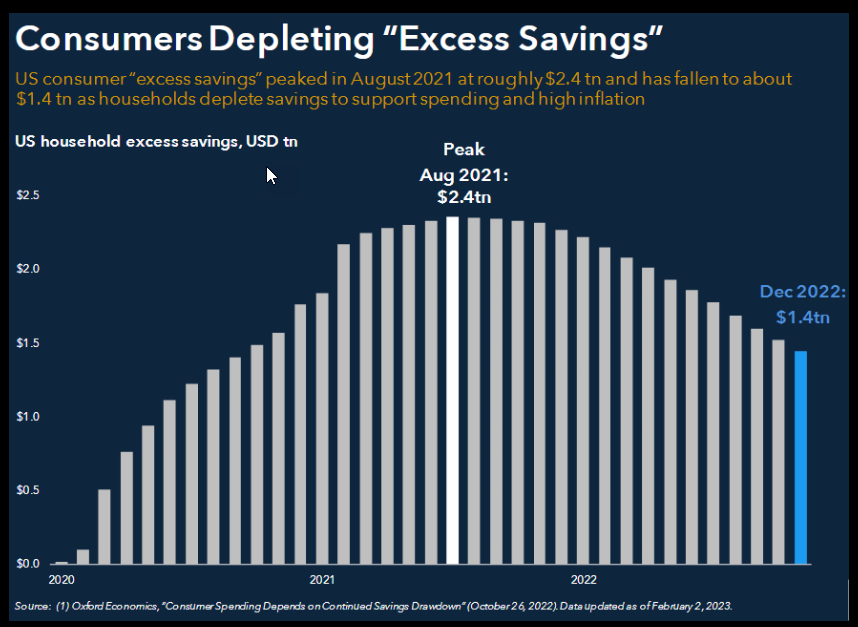
Savings are in fact coming down, but the consumer balance sheets are stronger than ever and there is still $1.4T of excess savings remaining. Debt service as a percent of disposable income is near historic lows:

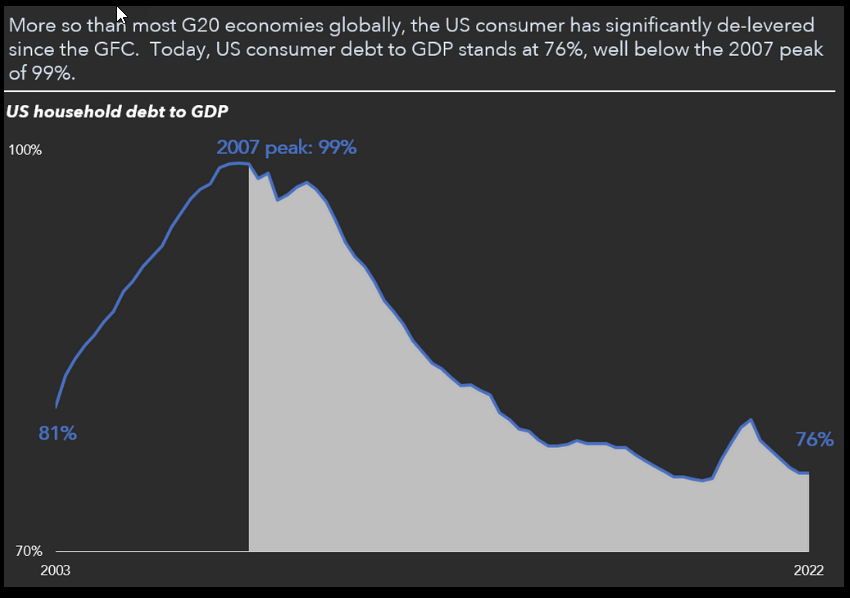
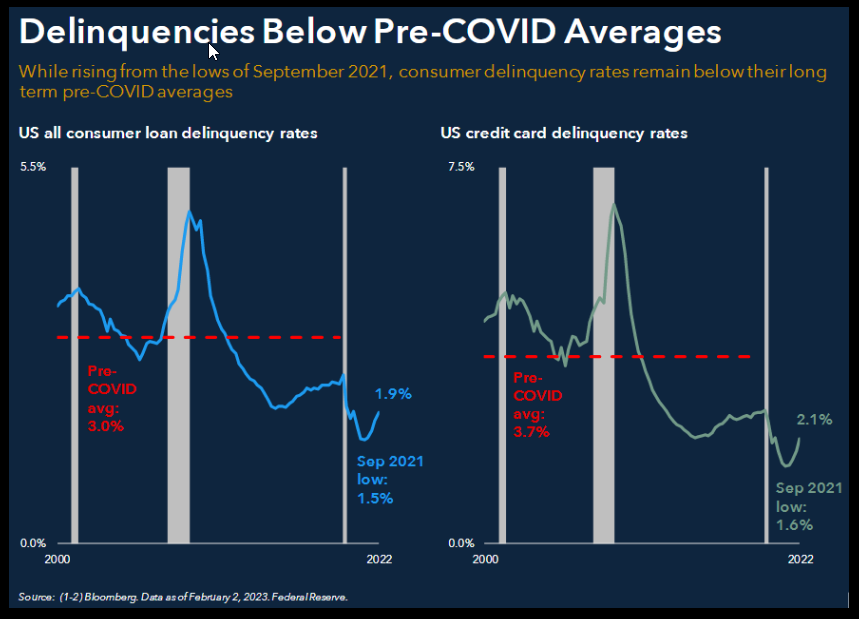
This is one reason that consumer delinquencies are still below pre-pandemic levels:
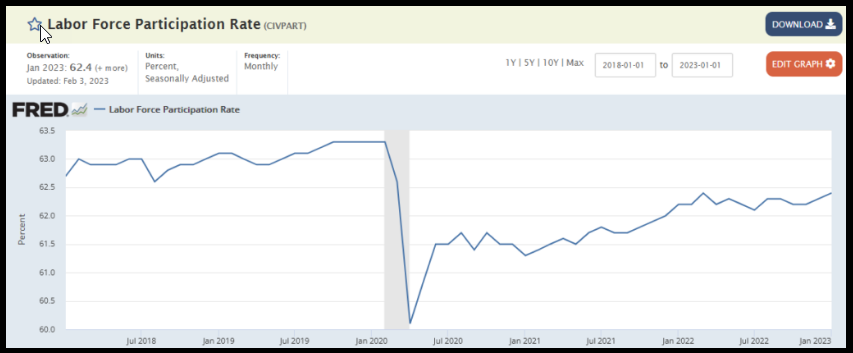
The underappreciated byproduct of the consumer running down their savings is that they are headed back to work. When we think about Chairman Powell’s goal to bring down wages through increasing unemployment, the other way to reduce wages is through an unexpected increase in the supply of labor – which we saw in Friday’s NFP (Jobs Report). The Labor Force Participation Rate unexpectedly hit the highest level since before the tightening cycle began, and tied for the highest labor force participation rate since the pandemic began in 2020 at 62.4%:
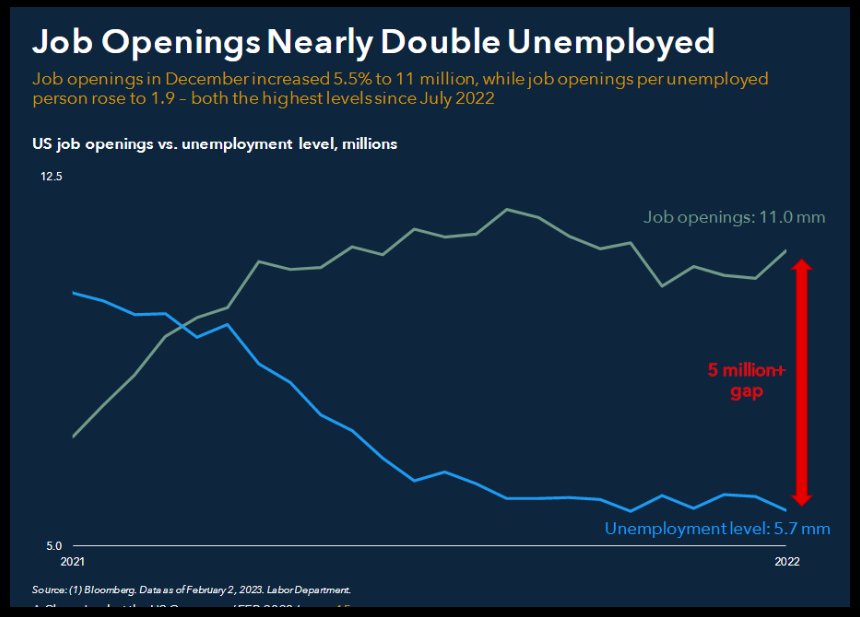
As people spend down their savings they continue to go back to work – and considering there are nearly two jobs available for every person unemployed, jobs are getting filled quickly:
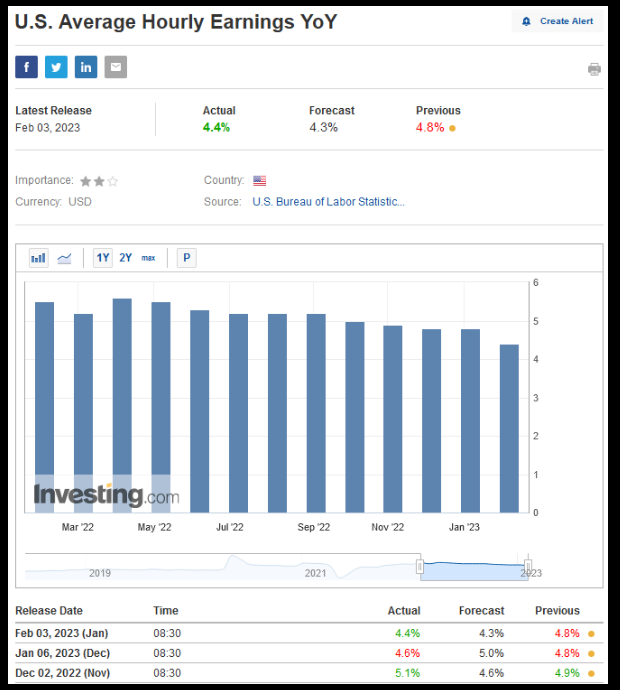
This new supply of labor is starting to give employers some hints of negotiating power as we see average hourly earnings coming down each month (meeting Powell’s goal):
10
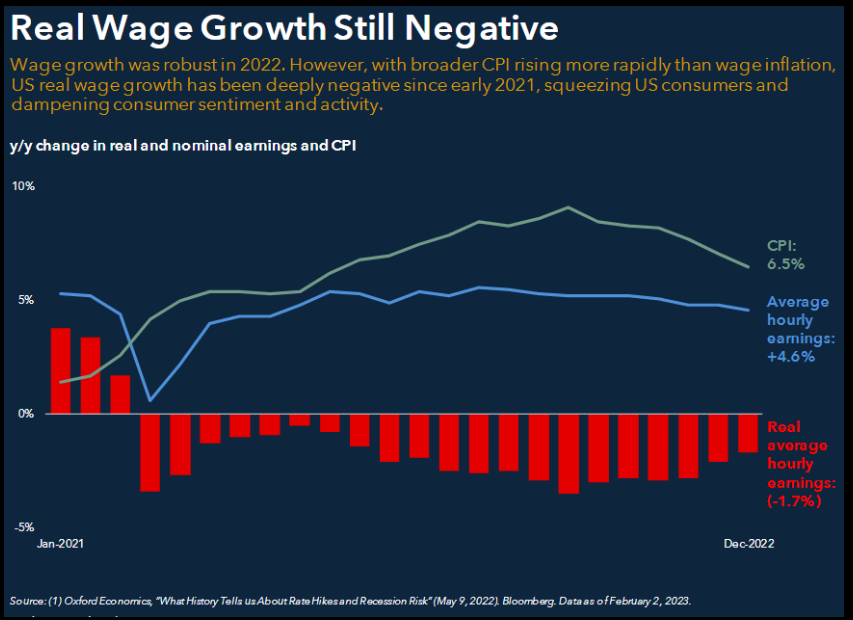
In real terms, wage growth is still negative. This is one more reason additional household members are getting jobs once again:
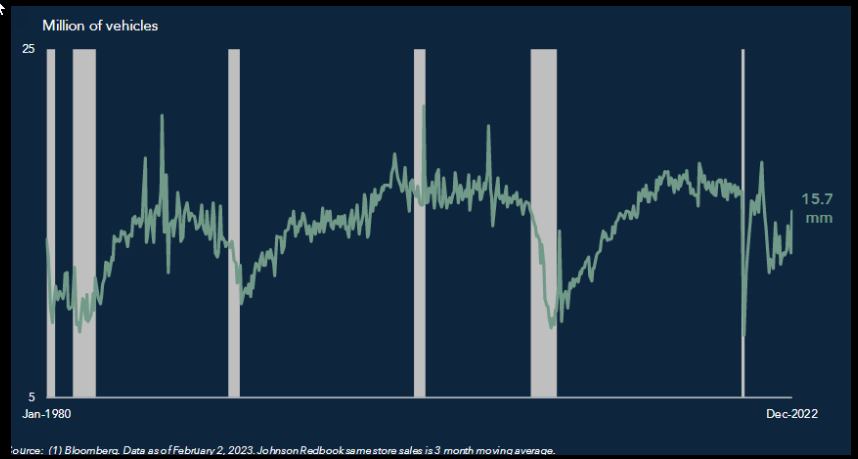
One thing people need when an additional household member goes back to work is another car. While 2022 had the lowest U.S. car sales in over a decade, January of 2023 had a SHARP rebound in sales to near 2 year highs (as a result of supply shortages easing, pend up demand and manufacturer/dealer incentives beginning):
Sector Rotation
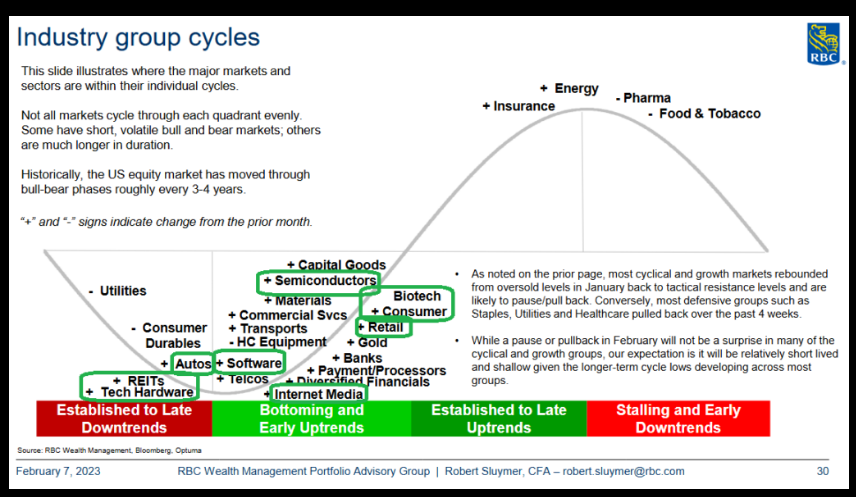
At the end of last year, on our podcast|videocast we emphasized the concept that the “Last Shall Be First” and those groups/sectors that no one wanted to touch were where the opportunity was (beyond BABA, CPS, Biotech) for 2023. That has held true in spades as Tech, Communication Services and Consumer Discretionary have all outperformed in the first month+ of 2023. With the up ~17.5% off its December lows, do not expect it to continue at the same pace. Think about what that would be annualized!
There will be consolidations and “fits & starts” along the way. The big money will be made locating opportunities under the surface on a discrete basis – stock by stock (company by company). There is still a tremendous amount of opportunity for 2023.
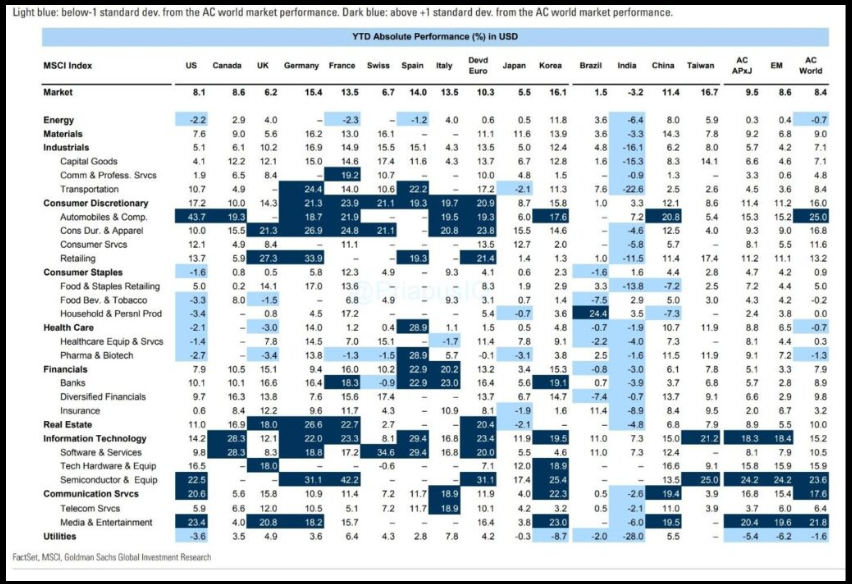
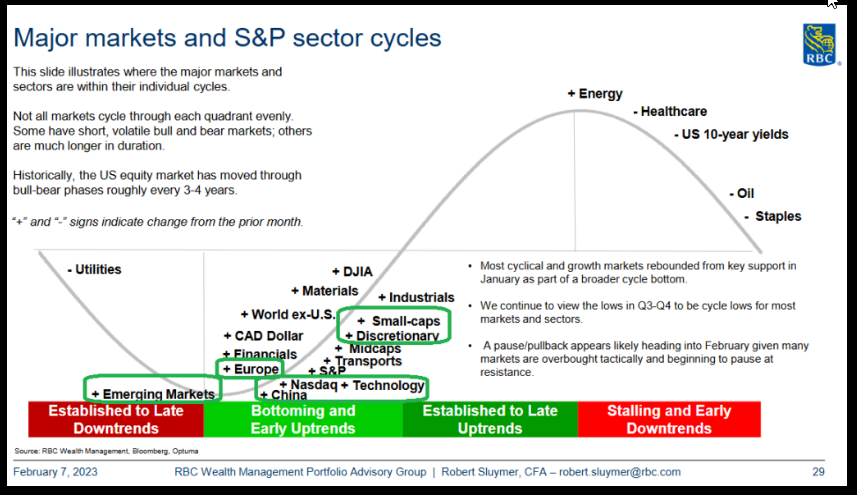
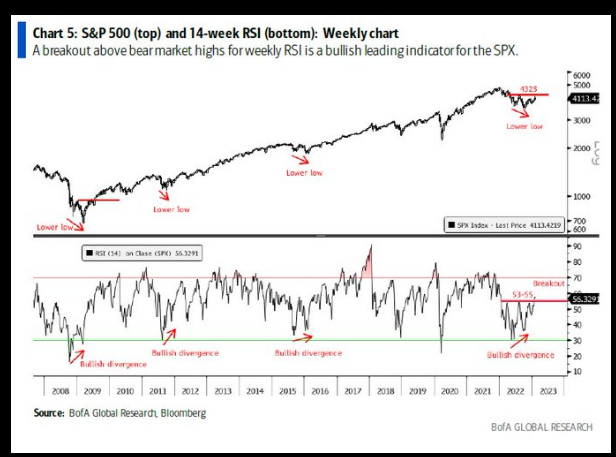
This is consistent with what happens coming out of bear markets. What fell the hardest in the bear market, bounces the most in a new bull market. We are focused on what works in the early stages of new uptrends. Thanks to RBC (TSX:) for these slides:
More to come:
16
Now onto the shorter term view for the General Market:
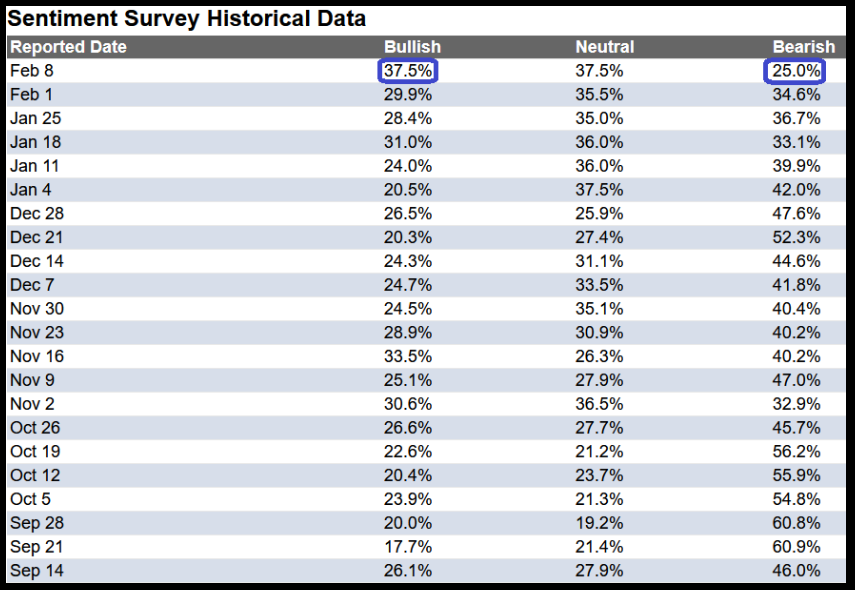
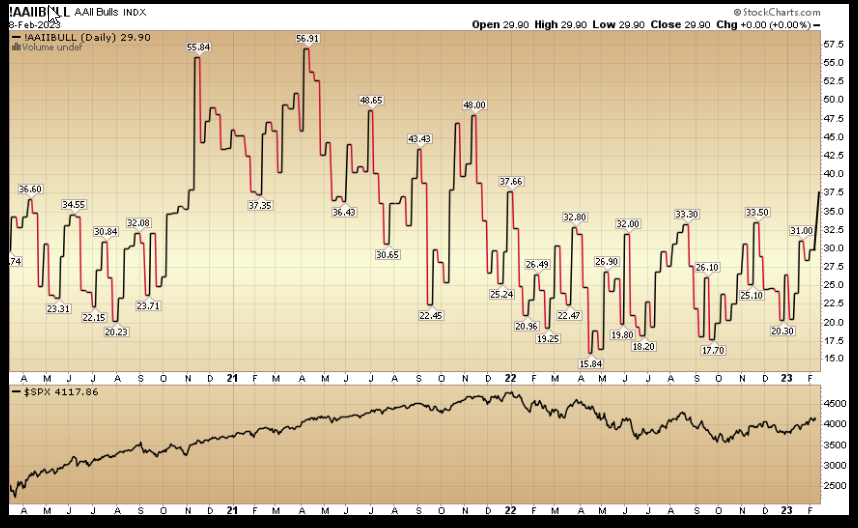
In this week’s AAII Sentiment Survey result, Bullish Percent (Video Explanation) jumped to 37.5% from 29.9% the previous week. Bearish Percent collapsed to 25% from 34.6%. Sentiment is now getting hot, but could run even hotter. It would not surprise me if it stays pinned at high levels for some time as this is the highest level we have hit since before last year’s bear market, but nowhere near peak euphoria:
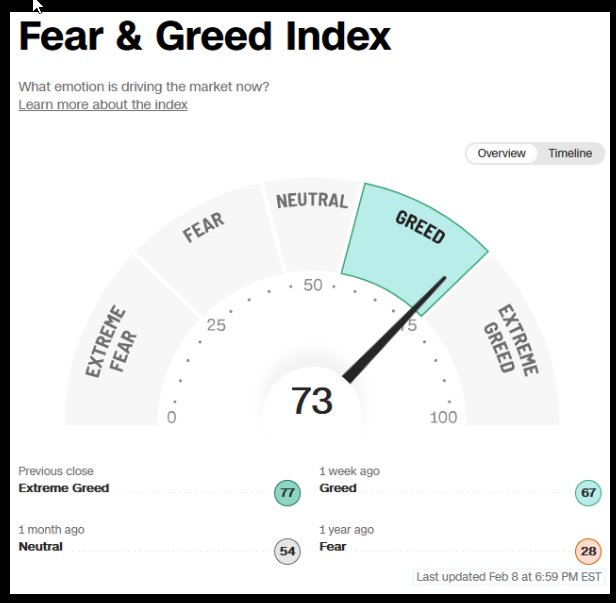
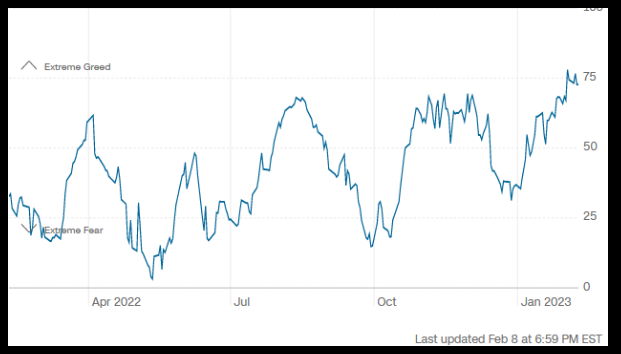
The CNN “Fear and Greed” flat-lined from 73 last week to 73 this week. Sentiment is getting hotter. You can learn how this indicator is calculated and how it works here: (Video Explanation)
19
20
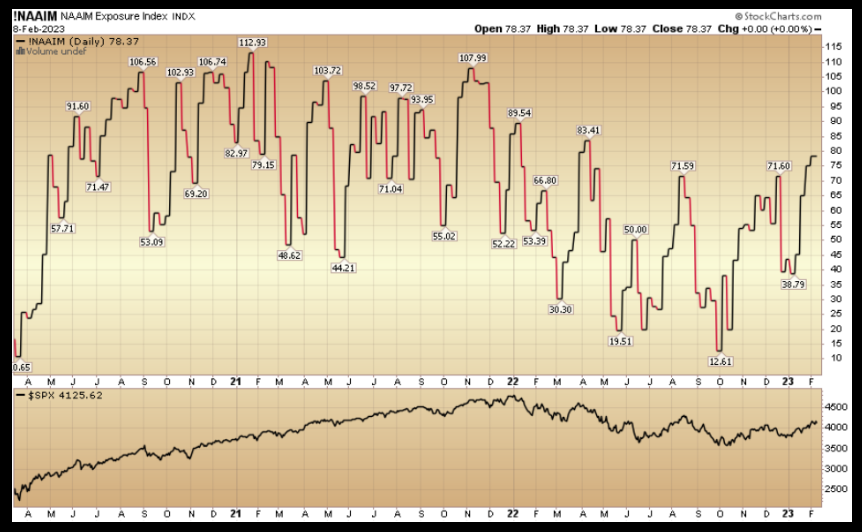
And finally, the NAAIM (National Association of Active Investment Managers Index) (Video Explanation) ticked up to 78.37% this week from 75.23% equity exposure last week. Managers are now chasing as they came into the year with record levels of cash.
This content was originally published on Hedgefundtips.com.